

https://lookerstudio.google.com/u/0/navigation/reporting
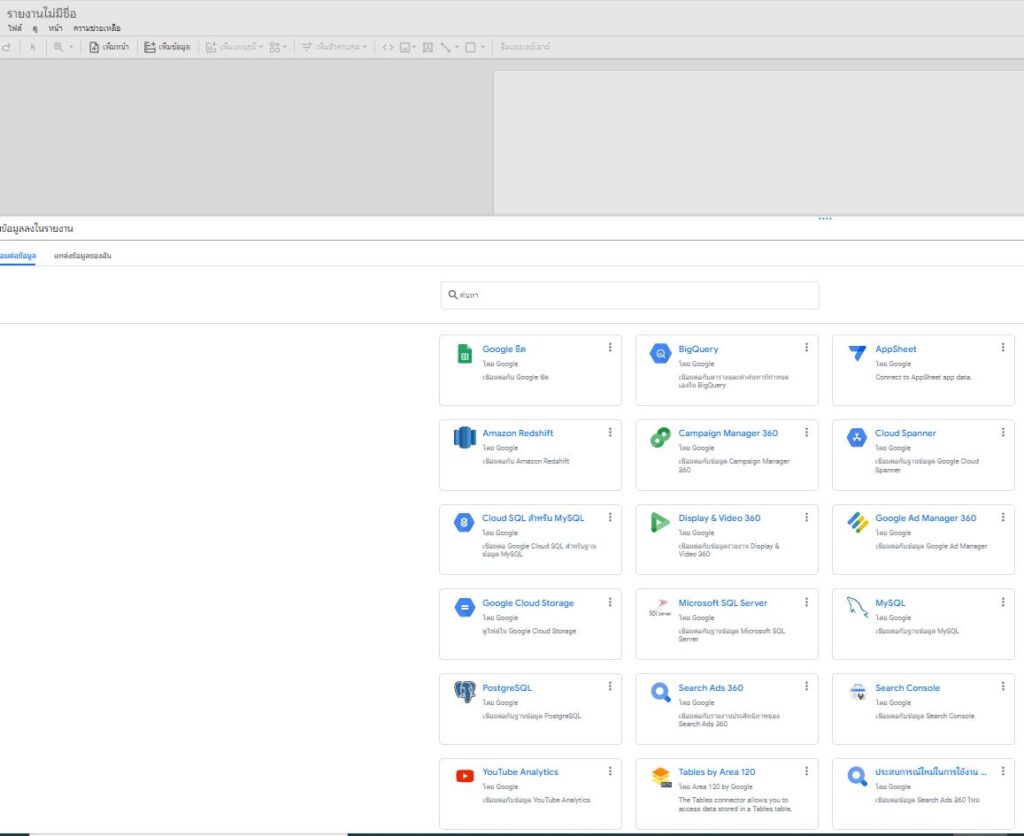
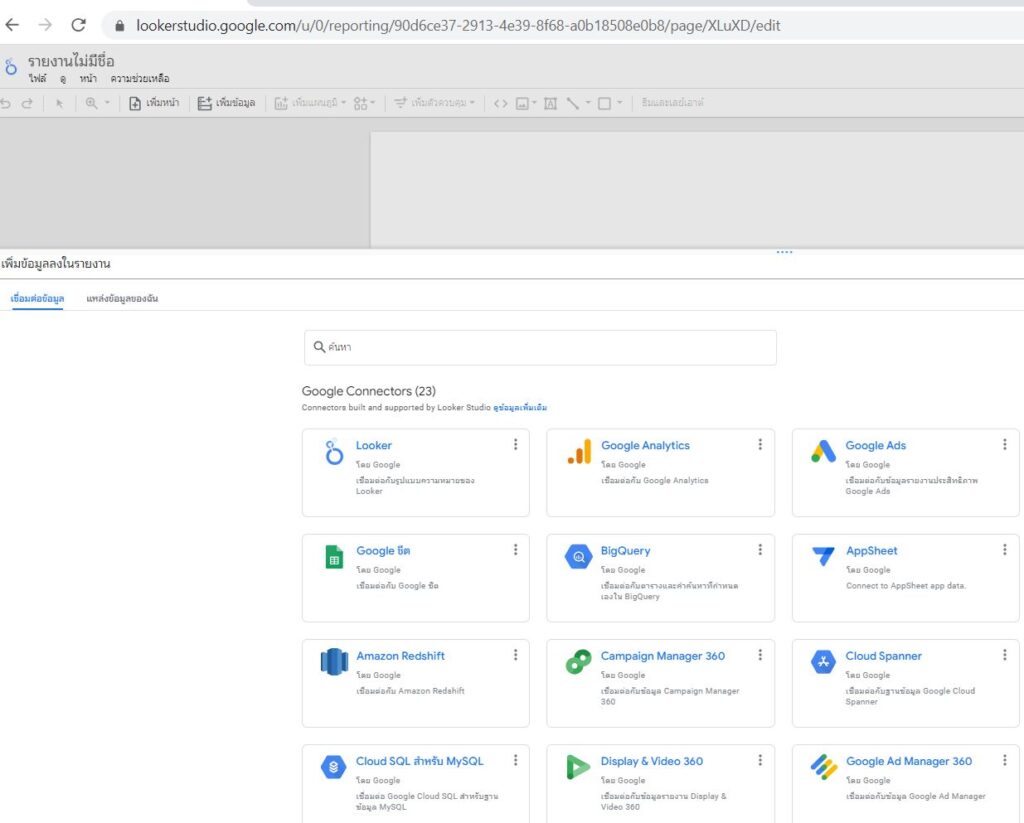
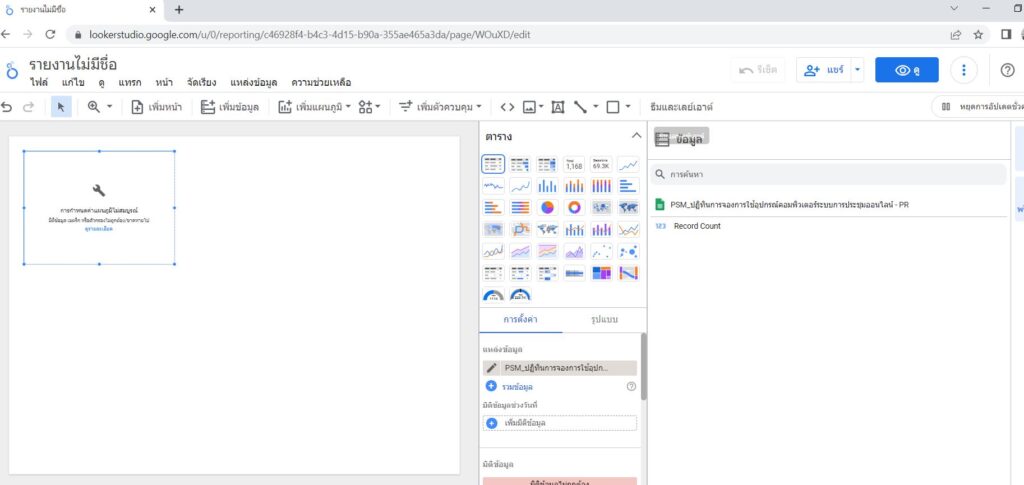
- เข้าไปที่ https://lookerstudio.google.com/u/0/navigation/reporting จะสังเกตุได้ว่า Lookerstudio สามารถใช้สรุปผลได้หลายบริการ
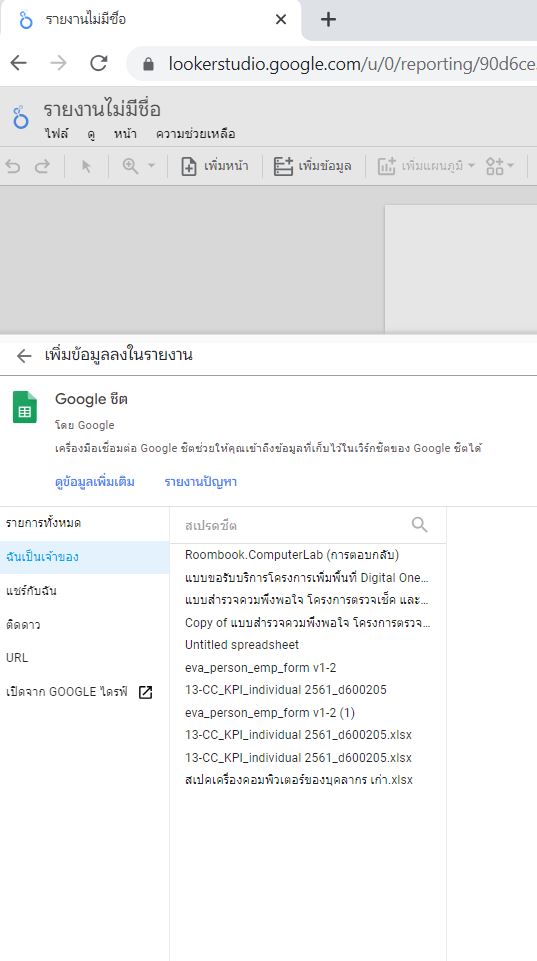
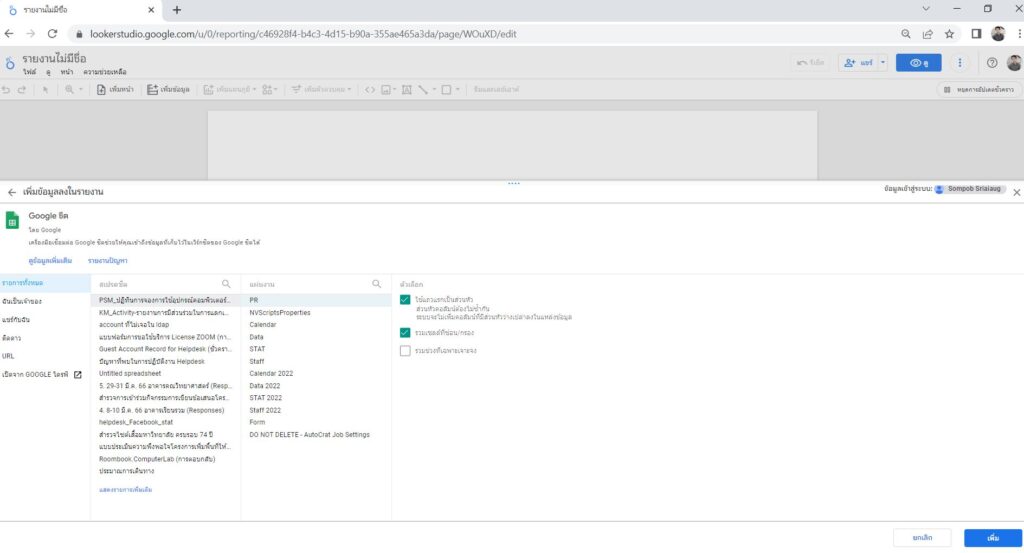
4.เลือก Google Sheet ที่ต้องการ แล้วกด “เพิ่ม/Add” ที่จะใช้ในการสรุปผล
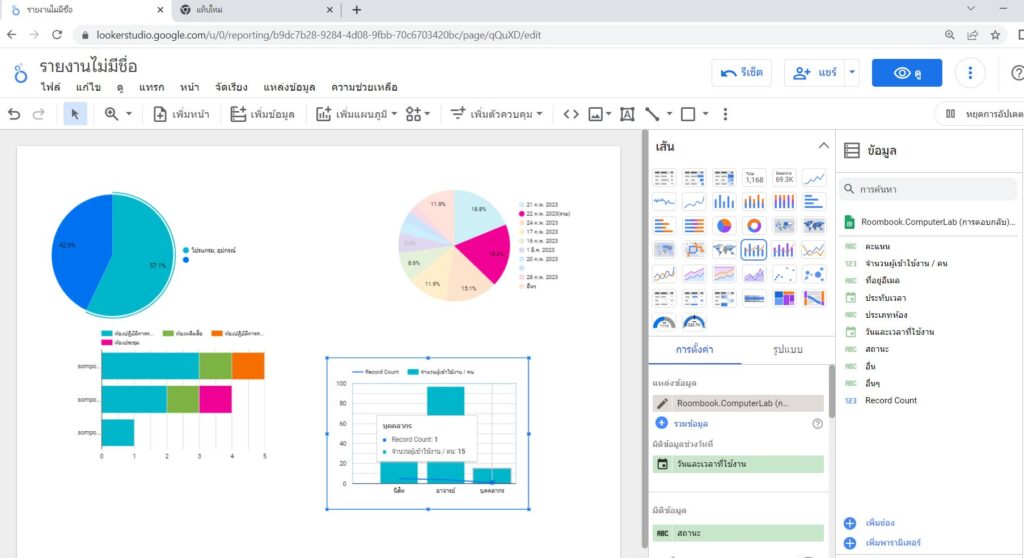
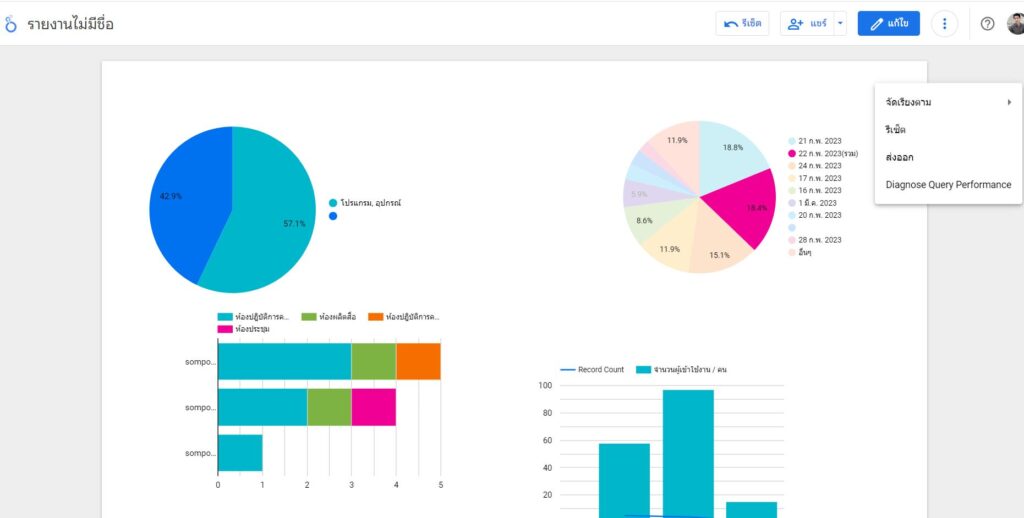
5.มีหลายรูปแบบที่ใช้แสดงผล เลือกได้ตามความชอบ
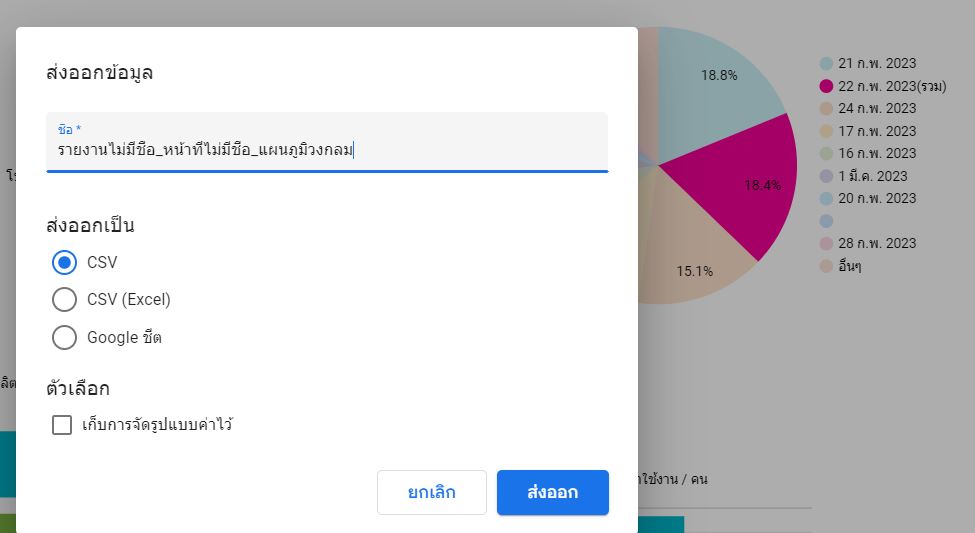
6.สุดท้ายสามารถ Export File สรุปผลเผื่อนำเสนอได้เลย
